Physical Activity Level
The activity level only impacts the indicator «Energy Expenditure»
This is a coefficient of activity applied to the Basal Metabolism for obtain the overall daily energy expenditure.

Basal Metabolic Rate) x (PAL) = Energy Expenditure
Physical Activity Coefficients (Activity Level)
Very Low : 1.2 / Low : 1.4 / Average : 1.6 / High : 1.8 / Very High : 2
Physical Activity Coefficients (Professional Athletes)
Light Training : 1.6 / Average Training : 1.8 / Intensive Training : 2.2 /
Competitive Level : 2.5 / High Competitive Level : 3
BMI
This is weight divided by height in m squared. If the BMI is between 18.5 and 24.9, it is considered to be within the normal range. Below 18.5 it is too low and above 24.9 it is too high. Between 24. 9 and 30 the BMI indicates a situation of overweight, from 30 we speak of obesity and from 40 of a situation of great obesity.

Warning: It is only a first indicator that can be misleading.
For example, an athlete with a high muscle mass will have a high BMI without having a high fat mass.
If the BMI is too low, it can indicate probability of undernutrition.

Tiles to check in priority:
Crude fat mass or constant hydration—Skeletal muscle mass and/orAppendicular muscle mass —Fat free dry mass —Basal metabolic rate.
Phase angle
It is fundamental data in prevention and follow-up of pathologies. It can also be used to monitor the physical condition of athletes.. From the measured phase angle and impedance value at 50 kHz the reactance is calculated which reflects the amount of cells and the resistance which represents the water volume.
The reactance reflects the quantity of cells, the resistance, the volume of the water compartments and the phase angle the functionality of the cell membrane.
t is a true health indicator used particularly inthe medical field for the follow-up of patients with serious diseases such as cancer and physical condition in other cases.
A high phase angle indicates good health, a low phase angle can be a sign of potential health problems.
In young and healthy people, it varies very little. It can decrease due to a temporary poorphysical condition (exposure to hightemperatures, after a flu-like condition . . . ), aswell as during natural phenomena such asageing. When the cell membrane is weakened, its ability to maintain tension thus decreasesthe phase angle.

( see at the bottom of the page section IV additional information « the phase angle » )
II)Synthesis
This part of the dashboard is intended to allow you to obtain a synthetic photograph of the interpretation of the measurement before going into the detail of each tile.
The Target
The target is a representation of the body components and the good or poor condition of the body matters.
The beads positioned in the different circles represent the person’s body balance in relation to the reference values.
Theoretical deviations are used to compare the patient’s values with reference values that take into account gender, height, weight and age. Above the target are three theoretical gaps : Muscle mass, Fat mass and Total body water. The values appear in the same color as the target and allow you to immediately visualize a good balance, a deficiency or an excess.

Calculation method:
Fat mass kg = Fat mass -Reference fat mass at constant hydration.
Muscular Mass kg= Skeletal Muscular Mass -Skeletal Muscular Mass of ref.
Water volume L= Total water without fat tissue water -Reference value for total water without fattissue water.
Indexes
The indexes located under the target can help assess the balance of the individual. The index range is 0 to 2, the reference value being 1.
The index value of the fat mass may be higher than 2 but only in the case of severe obesity.
If the values are in orange or in red, this is a warning signal.
Calculation principle:
For the fat, muscle andbone mass indices the index is calculated from the value calculated on the reference value.
For muscle load, this is the muscle mass index divided by the bone mineral content index
For total load, the calculation is as follows: ((Fat mass index + muscle mass index) /2)/ bone mineral content.
Fat Mass: If the index is above 1, the patient has excess fat.
The colour of the value will indicate if the gap with the reference value (1) is an issue to be monitored. If the index is below 1 but the value is in green, there is nothing to worry about.
If the index is in light green, the gap with the reference value is getting close to orange or red. The Fat Mass is getting too low or too high and is to be monitored.
Warning: If this index is too high and in orange : Risk of Obesity– If the index is too high and in red : obesity– If the indew is too low and red : risk or hormonal imbalance.
Muscle Mass : If the index is above 1, the muscle mass is good. The higher the index, the higher the muscle mass. If the index is above 1 and in green, the muscle mass is close to the reference value. If the index is in light green the muscle mass is slightly low and should not decrease. If the index is orange, the muscle mass is too low and if red, the muscle mass is much too low.
Warning: If the index is light green the muscle mass should be monitored (except for vegetarians who naturally have a light muscle mass because of their nutrition) - If the index is orange or red, other indicators should be checked such as appendicular skeletal muscle mass and the sarcopenia index, the Body Cell Mass , the metabolic proteins and the phase angle.
Bone Mineral : If the index is 1 or above, this is good. The higher the index, the higher the bone mineral content. If the index is below 1 and in green, the bone mass is close to the reference.
From the light green, the age of the person will be taken into account to assess the risk of lowor too low bone mass.
Warning: If light green, the bone mass is to be monitored - If orange - a DEXA scan should be prescribed to verify the risk of osteopenia or osteoporosis.
If the index is red- a DEXA scan must be prescribed because the risk of osteopenia or sarcopenia is high.
Muscle Load and Total Load: the skeleton, the tendons between the muscles and the bones and the joints are put under more or less strain depending on the muscle mass and total weight of the patient. A high level of strain can cause damages. The ratio between the skeleton and the muscle mass and weight is an important indicator.
Warning: If the indexes are orange or red, the load is too high and can lead to injuries.
III)Detailed presentation of body elements
Each “Tile” of analysis illustrates a different indicator
Body Element : The measured body compartment, for example: Crude Fat Mass
Unit : The calculation mode in kilo, litre or percentage.
Calculated Value : The value which has been calculated from the measurement.
Estimated Reference: The value used to calculate the theoretical gap.
Theoretical Gap: The difference between the result of the patient’s measurement and the reference value. The color of the values indicate if the patient is within the standard (green), close to the standard (light green), to be monitored (orange), to be treated (red)
Tube Graph: The position of the cursor (Triangle) indicates the level calculated for the patient. The colors in the tube indicate if the patient is within the standard (green), close to the standard (light green), to monitor (orange), to be treated (red).
History: This is the difference between themeasurement of the day and the previousmeasurement(s) (the graph is presented for thelast 4 measurements), a click on history willallow you to view all the results for thisindicator).
Additional Information : Located at the bottom of the tile
This is the energy expenditure necessary to maintain the body’s vital functions when it is at rest. It is given on a 24-hour basis. It is essential for assessing daily energy expenditure in both sports and medical environments.
Warning: If the cursor is in the orange and especially if in the red. Undernutrition, serious diseases, obesity, sports monitoring, prevention.
Tiles to check in priority:
Crude fat mass, Energy expenditure, Recommended energy intake,Dry fat free mass
Calculation method :
Formula based on the Harris and Benedict formula, but readjusted to replace the person's weight by their dry fat free mass
Basel Metabolism calculation method: Harris and Benedickt.
This is the total amount of energy expended by the body during a 24-hour day. It is the Basal Metabolic Rate multiplied by the level of physical activity.
This tile gives also the recommended energy intakes: The right balance is to have a balanced diet in calories in relation to energy expenditure. People with excess fat will therefore be advised to eat a slightly lower calorie diet (-5 to -20%) which will allow them to gradually reduce this excess. By increasing the level of activity, and therefore the energy expenditure, the excess fat will decrease.
Warning: If the cursor is in orange or red.
serious diseases, obesity, sportsmonitoring, prevention.
Tiles to check in priority:
Fat-free dry mass, Crude fat mass, Basal metabolic rate,Recommended energy intake
Calculation method :
Method of calculating energy expenditure: Coefficients applied to the basic metabolism (MB) :
MB very low * 1. 2
MB low * 1. 4
MB medium * 1. 6
MB high * 1. 8
MB very high * 2
3. Crude Fat Mass In Kg

These are the lipids contained in the fatty tissue, the rest of the materials that make upthe fatty tissue are part of the fat free mass( water, proteins, etc. ).. The fat mass should be neither too high nor too low. The low range corresponds to a % of the fat weight in relation to the total weight and mustnot be less than 7% for men and 12% for women. The high range of good balance is indicated in the column "Estimated reference"
it varies according to sex and age.
Calculation method :
Calculation of the gross fat mass in kg: Weight of the person (W) - Fat-free mass Calculation of the reference fat mass(maximum desirable value) in %: according to age from 14 to 70 years and fixed beyond 70 years.
For a man about 14% to 25% and for a woman about 18% to 30%.
Calculation of the reference crude fat mass in Kg = % reference fat mass in Kg x weight in kg.
4. Fat Mass At Constant Hydratation

The % fat mass is calculated from the weight of fat mass and the total weight. With the same fat s in kg, an over hydrated person will have a higher weight due to excess water
And consequently a lower % fat mass.
On the basis of the concept of "Fat mass at constant hydratation"the virtual weight of the person at idealhydration is calculated.
In these conditions the result of the fat mass in % will not be distorted by the fluctuation
of the hydration level, there fore of the weight and consequently of the% fat mass.
Warning: If too high Orange: Excess fat and risk of obesity— If too high in Red: Obesity. In both cases cardiovascular risks, metabolic risks, risk of type II diabetes—If too low in red: Risk of hormonal disruption in women.
Tiles to check in priority:
Cardiovascular risks—Metabolic risks—Basal metabolism rate—Energy expenditure—Body cell mass—Fat free hydration level.
Calculation method:
Constant hydration fat mass: We recalculate the person's weight at ideal hydration, then divide the fat mass in kg by this readjusted weight to obtain a constant hydration %.
The Fat Free Mass is a person’s Weight less his Fat Mass weight in Kilos.
It is composed of the total body water + minerals + proteins.
This data is to be used for more advanced analysis, hydration rate of fat-free mass.
Warning: If the hydration rate of the fat-free mass is less than 69% or more than 77%.
Tiles to check in priority: Soft Lean Mass = Dry Fat Free Mass without bones - Bone Mineral Content - Metabolic Proteins - Fat Free Hydration -Water Balance
Calculation method:
Calculation of the Fat Free Mass: Evaluted Aminogram formula versus DXA.
Calculation of the hydration rate of the fat free mass = Total water divided by fat free mass. Calculation of the Lean Mass = Fat free mass- Bone mineral content
The FFMI value will soon be displayed, it is the weight of the fat free mass on the height squared in meters. The low limit values for diagnosis of undernutrition are given by ASPEN and taken up by the HAS - 17 (H) and 15(F).
.
6. Dry Fat Free Mass

The Dry Fat Free Mass is the Fat Free Mass without water, it is the proteins and minerals. The analysis of the evolution of the Dry Fat Free Mass is particularly interesting if the patient is following a diet. If the history shows a regular or considerable decrease of the Fat Free Mass this means that the body is using up its protein reserve which is not advisable.
Warning: If pale green: to be monitored—Orange: Significant deficiency, poor food and physical hygiene, risk of sarcopenia and undernutrition—Red: Significant risk of undernutrition, serious pathologies.
Tiles to check in priority:
Phase Angle, Metabolic protein mass, Body cell mass, Basal metabolic rate, Bone mineral content.
Calculation method :
Calculation of the reference value of the dry fat free mass : The reference dry mass excluding fat is assessed individually. The reference dry fat mass will therefore take into account the individual's dry mass calculated at time T, corrected by the theoretical gap in positive or negative skeletal muscle mass, and by the theoretical gap in extracellular solids.
Wording
|
Acronym
|
UniT
|
Dry fat free mass
Dry fat free mass reference
Theoretical Gap
|
DFFM
DFFM_REF
DFFM_ET
|
kg
|
Skeletal Muscle Mass
Skeletal Muscle Mass on Dry Fat Mass
|
MMS
MMS_PC_REF
|
kg
%
|
Extracellular solids
Extracellular solids reference
Theoretical Gap
|
ECS
ECS_REF
ECS_ET
|
k
|
7. Bone Mineral Content

Very important data in the medical environment to alert on a risk of osteopenia and/or osteoporosis which will be validated by a DXA examination.
Warning: If the Bone Mineral content is in the Orange: monitoring and verification with other techniques such as DXA are recommended.
If the BMC is in Red, very high probability of osteopenia or osteoporosis.
Tiles to check in priority:
Fat-free dry mass—Appendicular muscle mass—Crude fat mass.
Calculation Method :
Method of calculation of bone mineral content (calculated): Validated manufacturer's formula versus DXA. Calculation of the reference bone
mineral content: BMC*BMC index
Extracellular Solids: This refers to the bone mineral content + non-metabolic protein mass such as collagen and elastin including.
Calculation: Bone mineral content * acoefficient given by the literature
Non-osseous Minerals: This refers to minerals contained in cells such as potassium or sodium
Calculated by applying 2 coefficients given by the literature for intra- and extracellular water respectively
8. Body Cell Mass

The Body Cell Mass is the set of metabolically active cells in our body.
It is essentially composed of intracellular water, metabolic proteins, intracellular minerals
and glycogen contained inorgans such as the heart, brain, viscera, muscles. . . .
There are 2 important elements to monitor:
- The amount of metabolic proteinin relation to total BCM
- The volume of intracellular water (ICW)
For example, the performance level of athletes can be affected by the hydration level of this cell mass.
One must be careful with diets that do not provide enough protein, because the body to function will draw on its reserves mainly muscular. Muscle mass decreases and there fore there is a decrease inactive cell mass.
Calculation method:
Method of calculating the calculated BCM: Addition of intracellular water+ metabolic proteins + intracellular bone-freeminerals. Reference BCM Calculation Method: Calculated from the reference metabolic protein mass to which the reference intracellular water the reference intracellular boneless mineral
These are the proteins inside the Body Cell Mass. If the Body Cell Mass is high and the intracellular water is normal, the level of Metabolic protein mass is high. These 3 indicators BCM (Body cell mass), ICW (intracellular water) and Metabolic protein mass are very useful in high-level sports preparation.
Warning: If in the orange and especially if in the red: Sarcopenia, poor diet, low activity level, undernutrition, degenerative diseases and cancers..
Tiles to check in priority:
Fat-free hydration—Water balance—Appendicular muscle mass—Fat free dry mass—Bone mineral- Phase angle
Calculation method:
Calculation method formetabolic proteins:
Dry mass excluding fat with out extra-cellular solids and bone-in minerals
Calculation method for metabolicproteins: Reference dry mass without extra-cellular solids and bone-in minerals Reference method for metabolic proteins: Reference drymass without extra-cellular solids and boneless mineral
Total proteins = Metabolic proteins + Supportproteins (collagen, elastin. . . )
This is what is commonly referred to as “the muscles”. There are about 600 of them and they are attached to the skeleton. This tile is more suitable for the sports and fitness sector than the appendicular skeletal muscle mass. Skeletal Muscle Mass contains also a certain amount of water contrary to Dry Fat Free Mass.
Warning: If pale green: to be monitored—Orange: Significant deficiency, poor food and physical hygiene, risk of sarcopenia and undernutrition—Red: Significant risk of undernutrition, serious pathologies.
Tiles to check in priority:
Phase Angle, Metabolic protein mass, Body cell mass, Basal metabolic rate, Bone mineral content.
Calculated Value Skeletal Muscle Mass:
It is calculated based on the equation of Skeletal Muscle Mass of Limbs divided by 0. 76 (this average coefficient is given in the literature).
Estimated reference: Unlike Fat Free Mass, this reference value is not based on the individual himself, as it would not allow to show an increased muscle mass as in some athletes, or in active obese people. It is calculated from the normal fat-free mass to which is applied a % of normal skeletal muscle mass given in the literature (this % is different according to gender). Other value communicated at the bottom of the tile MHG ratio: This is the ratio in % of the calculated skeletal muscle mass to the fat free mass.
( see at the bottom of the page section IV additional information for persons with a high % fat content)
Wording
|
Acronym
|
Unit
|
Dry Fat Free Mass
Dry fat Free Mass reference
|
FFM
FFM_REF
|
kg
|
Skeletal Muscle Mass
Skeletal Muscle Mass reference
Skeletal Muscle Mass on Dry Fat Mass
|
MMS
MMS_REF
MMS_PC
|
kg
kg
%
|
Index Dry fat free mass (FFM/hauteur au carré en mètre)
Index Dry fat free mass reference
|
FFMI
FFMI_REF
|
kg/m²
|
Theoretical Gap
|
MMS_ET
|
kg
|
Apendicular skeletal muscle Mass
|
ASMM
|
kg
|
Déroulé des calculs
|
Calculs
|
MMS
|
ASMM/0,76
|
FFM_REF (gender)
|
FFMI_REF * ht² (height measured in meters)
|
MMS_REF (gender)
|
FFM_REF * Report MMS/FFM
|
MMS_ET
|
MMS - MMS_REF
|
MMS_PC
|
MMS/FFM
|
Results displayed on the tile
|
Skeletal Muscle Mass
|
MMS
|
Calculated Value
|
MMS_REF
|
Estimated Reference
|
MMS_ET
|
Theoretical Gap
|
MMS_PC
|
Ratio on Fat Free Mass
|
11. Apendicular Skeletal Muscle Mass

These are the muscles attached to the arms and legs. The index at the bottom of the tile is an important Indicator. If the calculated value is lower than the index, there is a presumption of sarcopenia. This tile is therefore particularly suitable for the medical sector.
Warning:
If the index is below 7.23 for men and 5.45 for women. Sarcopenia, poor nutrition, low activity level, undernutrition, degenerative diseases, monitoring of muscle mass development or loss of muscle mass in athletes. These values come from Baumgartner'spublication of the American Rosetta study. These cut-offs may vary according to studies and ethnicity. The sarcopenia situation is not assessed on this value alone, but must be correlated with grip strength and locomotion tests. For people with a high fat mass potential, small people, these cut-offs are not always suitable. In these cases, the Skeletal Muscle Mass (SMM) report at the bottom of the Skeletal Muscle Mass tile should be consulted
.
Tiles to check in priority: Metabolic protein mass—Body Cell Mass—Fat free hydration level—Bone Mineral Content—Fat Mass.
Calculation method :
Calculation of the apendicular skeletal muscle mass of the : based on the workand publications of Ursula Kyle. Method ofcalculation of the apendicular Skeletal Muscular Mass of the reference : Reference MMS * 0,76
(see at the bottom of the page section IV additional information for persons with a high % fat content)
12. Total Water (In Liters)


This is all the water contained in the body.
Warning If orange insufficient : To be closely monitored—If red insufficient : To be treated first—If orange excess check intra/extracellular water balance—If red excess: to be treated first.
Tiles to check in priority:
Fat-free hydration level—Water balance—Fat- free water balance—Body Cell Mass—Phase angle.
Calculation method:
Total water: Based
on the published equation by Robert F. Kushner andSchoeller. Total reference water: see tile "fat free hydration
Fat Free Hydration = Hydration of the Fat Free Mass.
Normal range is around 73.3%. Much more interesting data compared to the Hydration Level.
Hydration Level= (TBW)/Weight (W)
Normal ranges are in general between 55 to 65%.
This data is less interesting because the fat mass contains only very little water (about 13%) and there fore the hydration rate of obese people will always be very low.
13. Fat Free Hydration Level

Fundamental data, this tile is to be checked systematically, as well as its evolution. While the water level in the fat layer is constant, the water level in other tissues is constantly changing. This indicator provides a good representation of the person’s hydration regardless of the body fat percentage. The reference value is 72.5%, but can vary depending on the individual, the time of day... The most important is to have a hydration level higher than 68% and lower than 76%. The result must be moderated on people with a high proportion of fat mass, as fat water in these patients can be a lower %, which consequently leads to a lower % of fat-free hydration.
Warning: If in the orange and especially if in the red. Follow-up of the elderly, of all persons with pathologies, follow-up of athletes, prevention.
Tiles to check in priority:
Total Water - Water balance - Water balance excluding fat - Active cell mass - Phase angle
Reference values:
Method of calculation of non-fat hydration: on the basis of total water in litres minus fat water in litres reduced to a value in % Reference value for non-fat hydration: on the basis of publications and an analysis of a thousand measurements.
(see at the bottom of the page section IV additional information for persons with a high % fat content
14. Water Balance (ECW/ICW)
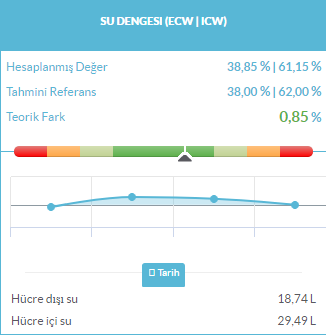
Fundamental data, this tile is to be checked systematically, as well as its evolution. This is the ratio between intracellular and extracellular water. It also varies according to the individual. it is important that this indicator lies within a deviation of no more than + or - 3 points from the reference value. One of the main causes of imbalance is due to excess or insufficient sodium.
Extracellular Water + Intracellular Water = Total Body Water
Warning: If in the orange and especially if in the red. Renal, hepatic, cardiac, lymphedema, unbalanced diet, poor nutrition, sports monitoring.
Tiles to check in priority:
Total body water—Fat free hydration level— Fat-free water balance—Body cell mass.
Calculation method:
Acronyms used
ECW =Extra Cellular Water = Extra Cellular Water
ICW= Intra Cellular Water = Intra Cellular Water
TBW=Total Body Water = Total Water
ExtraCellular Water in L calculated value: Equation(ECW) published by Deurenberg.
Intra-cellular water (ICW): Total water (TBW) - ECWCalculation of the reference value of the water balance: In the literature a 40/60 average balance is given for total water.
Our findings onthousands of measures is that this balance isslightly different between men and women. Wehave therefore adjusted this reference.
The “water balance” indicator represents the global water balance, that is to say the total extra-cellular water and the total intra-cellular water, more precisely the balance between ECW and ICW in the total body water.
This balance depends on several factors such as the sodium/potassium balance.
The sodium is inside the ECW and the potassium is inside the ICW.
It is necessary to take into account that:
•The intra/ extra cellular water distribution is not the same in fat tissues and in non-fat tissues
•The water in non fat tissues is distributed as follows: 38% in ECW and 62% in ICW* for a Man/ 42% ECW and 58% ICW for a woman (theoretical values).
This ratio can vary:
•The water inside fat tissues is distributed as follows: 85% in ECW and 25 % in ICW. This ratio is fixed for both men and women, it does not vary.
•The global water balance will vary according to the Fat Mass Rate.
•A good water balance depends not only on the ECW/ICW distribution but also on the global water level.
It is possible to observe a good global water level but not well distributed between ECW and ICW.
It is also possible to observe an insufficient global water level or a high water level but a good ECW/ ICW distribution.
15. Fat Free Water Balance

For further analysis, the total water minus thewater in the fatty tissue will be taken intoaccount here. The water in fat tissue contains mostly extracellular water, which explains why people with a high fat mass have a greater expansion of the overall extracellular water compartment, with this extracellular water being added to that of the lean tissue.
- The two bars indicate the water balance without water in the fatty tissue.
- The two triangles indicate theimbalances in litres, taking into account thehydration rate.
ECW theoretical gap in liters: it is the quantity of fat-free extracellular water in liters compared to an estimated reference
Extracellular water is the water that circulates in our veins, in the lymphatic system and interstitial water.
ICW theorical gap in liters: it is the quantity of fat-free intracellular water in liters compared to an estimated reference.
Intracellular water is the water which is inside our cells.
Warning: If in the orange and especially if in the red. These 3 elements combined in the same tile provide more detailed data on renal, hepatic, cardiac, unbalanced diet, poor nutrition, and serious diseases.
Tiles to check in priority :
Total body water—Fat free hydration level— Water balance—Phase angle—Body cell mass—Metabolic protein mass.
Method of calculation:
A/ water balance excluding fat in %
1/ From the calculation ofthe total water content of the fat tissue, the specific distribution in % for ECW and ICW is applied ECW and ICW are obtained from the fat issue in litres
3/ The value in litres of the fat tissue calculated above is subtracted from ECWand ICW total respectively. ECW and ICW areobtained without the water in the fatty tissue
4/ The water balance is recalculated from the total water outside the fatty tissue. The waterbalance is obtained as a % of the lean tissuerepresented by the small bars on the 2 gauges.
The reference value for the water balanceexcluding fat for men and women respectivelywas obtained by statistical survey, and is37%/63% and 39. 5%/60. 5%.
The theoretical %deviation is obtained by the difference betweenthe calculated % value minus the reference %value indicated above.
B/ The theoretical differences in litres represented by the small arrows and indicated at the bottom of the tile.
1/ Take the valuecalculated in litres previously for ECW and ICWrespectively (without fat tissue water).
2/From the theoretical water deviation that you find inthe synthesis for example, the waterdistribution rate calculated for ECW and ICW excluding fat is applied to this deviation. Wethus obtain the theoretical deviation for eachwater compartment which is materialized bythe small arrows of the 2 gauges.
Advantages:
- "Small Bars" The result is not affected by thedifferent distribution of ECW and ICW in fat and non-fat tissue and only takes into account your lean tissue in which the variations may occur.
-"Small arrows" They take into account not only the balance between extra and intra, but also the rate of hydration outside fat, which can also fluctuate overall.
Example: For a person with perfect balance and overall under hydratione xcluding fat, the 2 small bars will be in the center of the gauges and the 2 small arrows willbe positioned in the lower area of the gauges(left).
16. Métabolic Risks And Cardiovascular Risk
These 2 tiles group together ratio results with their alert threshold (cut-off points). These alert thre sholds are taken from a publication accessible by the ? located on the tile. These are indicators that allow the practitioner, in relation to the profile of a patient already presenting proven pathologies, to monitor these ratios and to draw information on his nutritional status. These elements will complement the clinical examination and will enter as a complementary value in the prognosis of improvement or deterioration of the patient's overall condition. In addition, they make it possible to carry out investigations on subjects with no diagnosed pathology that will confirm or invalidate these potential risks. Important medical data at first measurement and annual follow-up.
Warning: If the score is high (close to 3), risk of cardiovascular or metabolic diseases
Tiles to check in priority : Fat Mass - Dry Fat Free Mass- Phase Angle
The tile «patient risk monitoring» shows anthropometric ratios which can be used to assess risks of obesity through the waist and hips measurements.
Publications are accessible by clicking on «?».
Warning : that these limit values may differ from one publication to another. You are free to assess these anthropometric values in relation to other references that you consider more appropriate .
What is the energy capacity ?
The point on the energy capacity This is thebody's reserve of calories, therefore the body'senergy reserve. That's how we're breakingdown our reserves:
The body matters are converted into calories to determine the energy reserve. This analysis allows to monitor a patient’s energy capacity during a diet and to know if the person has followed accurately the food plan.
Observations on persons with a high % fat mass (usually above 30%)
A - Hydration rate of persons with a high % fat mass
We know how to measure total water, extracellular water and intracellular water, but we cannot specifically measure the water in the fatty tissue, so we rely on publications that give it as a fixed and very low percentage of 13 to 14%. It is on this basis that we calculate the hydration rate of the non-fat tissue by deducting this water from the fat from the total water. Publications show that although the water in the fatty tissue is quite constant, it is not necessarily constant in people with a very high fat mass and who in the majority of cases have adipose tissue that is much less hydrated. This finding explains one of the reasons « very fat » people generally appear as underhydrated in the fat free hydratation level indicator. They are, but less than it actually appears in this indicator.
Therefore, we advise our users to weight the result of the Fat Free Hydration level when people have a high fat content and to consult instead the « Fat Free Hydrationlevel given in the « Total Water »tile or the « Fat Free Mass »tile. This rate uses total water and is therefore not disturbed by the risk of underhydration of the adipose tissue. In general, he will be closer to his normal range.
Observation: In fact, it is often observed that when these people lose their superfluous fat, their hydration level gradually returns to normal in the majority of cases. At that point, it will be more interesting to go back to the « Fat Free Hydration level »consultation
All this is technical and sometimes difficult to explain to the patient, we suggest that you reassure the patient with the following comments: « It is because of your excess fat that your hydration level is so low, but we have a second indicator for you that shows us that it is lower than it seems" « Your hydration level is low because of your excess fat mass, if we manage to lower your fat mass, your hydration level should gradually increase". For this type of person, it is therefore preferable to use the FFM « Hydration level »; found in the « Total Water » indicator or in the « Fat free mass » indicator.
Fat Free Mass = Total body Water + Dry Fat Free Mass
For example: An individual has a Fat Free Hydration level at 66.47% (the balance would be between 68 and 76% with an ideal value at 72.2%)
The
dark green zone is between 70 and 75%
The lower
light green zone is btween 68 and 70%.
The higher
light green zone is between 75 and 77%
The lower
orange zone is between 66 and 68%
The higher
orange zone is between 78 and 80%
ALL OTHER LEVELS OF HYDRATATION ARE IN THE RED ZONE
His Fat Free Hydration is 69.49%
(the balance would be between 71 and 76% with an ideal value at 73.3%)
The
dark green zone is between 71 and 76%
The
lower
light green zone is between 69 and 71%
The higher
light green zone is between 76 and 78%
The lower
orange zone is between 67 and 69%
The higher
orange zone is between 78 and 80%
ALL OTHER LEVELS OF HYDRATATION ARE IN THE RED ZONE
We can observe that this person has a low Fat Free Hydration level
(underhydration) but has a balanced fat free mass hydration.
Conclusion:
The fat mass of this person is much less hydrated than 13-14%.
This water is trapped and cannot move, it is necessary to help this person to lose fat in order to increase her hydration level.
B - Muscle mass of people with a high % fat mass
There are two ways to approach the estimation of the Muscle Mass of a person:
1 - Compare it with a standard individual, this is the result we get with the classical reference value and the theoretical gap. This indicator has the advantage of comparing the individual to an individual of the same size with normal muscle mass. So someone who has developed a high muscle mass compared to the standard will be assigned a high muscle mass and the same if he has a low muscle mass.
2 - At the bottom of the tile « Skeletal Muscular Mass » you have the indicator « ratio on MHG » the ratio Skeletal Muscular Mass to Fat Free Mass. The reference value is not given, but it is in the literature of about 49% for women and 51% for men. This result does not give us a value compared to a standard individual, but the ratio of his Muscular Mass to his Mass without fat, therefore in relation to himself. Which reference to rely on for people with high fat mass. It is difficult to compare a person in a situation of obesity for example with a standard individual, if he or she is small in stature with a low level of activity. For this type of profile, solution 2, the ratio of skeletal muscle mass to fat-free mass.
Example of the same person
His fat mass is extremely high (48. 21%), almost half of his body weight. It is small in size and low in activity.
Result based on the theoretical gap:
If compared with a standard individual. Her result is + 5. 03 Kg of skeletal muscle mass in the theoretical gap, which means that if she kept her weight of muscle mass after losing her excess fat, for her height she would have a very high muscle mass in relation to her new body weight. Result based on its ratio of muscle mass to fat-free mass. Its result is 48. 38%, just slightly below the reference value (49%).
Conclusion :
It has a fat free mass (muscle mass but also viscera . . ) which has developed in parallel with its fat mass, as is generally the case in this type of profile. Its theoretical gap is therefore high. By losing part of its fat mass, very likely its fat free Mass would decrease, including skeletal muscle mass, bringing it closer to the standard model. The most important
indicator as long as it has not lost a large part of its excess fat is therefore: the MHG Report
THE PHASE ANGLE (PhA) and THE IMPEDANCE REPORT (IR)
The phase angle gives information on the resistance of the cell membrane to the electric current.
A decrease of the resistance of the cell leads to a decrease of the phase angle.
It is increasingly used in undernutrition and for people with serious illnesses(Cancer . . . ) because it is also a predictor of mortality risk.
It is also a predictor of mortality risk. For more information, we recommend that you read this publication: KYLE, Ursula G. , GENTON GRAF, Laurence, PICHARD, Claude. Low phase angle determined by bioelectrical impedance analysis is associated with malnutrition and nutritional risk at hospital admission. Clinical Nutrition, 2013, vol. 32, no. 2, p. 294-299.
The studies give us only average results, but converge to admit that we enter a critical threshold (Cut off) if the Phase is below 4. 6 for women and 5 for men.
Apart from the Cut off above, it is difficult to give a precise reference value for each individual, as its phase depends on too many parameters (sex, but also size, muscle mass, active cell mass, activity level . . . ). This is why, unlike our other indicators, we do not give a reference value for a particular individual. However, with a little experience, one can fairly quickly identify whether the phase angle is high or low in relation to the person's profile.
General:
The taller, more muscular and younger people are, the higher the phase angle.
The phase in women is lower than in men because their active cell mass is proportionally lower, which of course does not mean that they are in poorer health.
Athletes who have developed a large muscle mass, will therefore have a higher phase than a standard individual of the same size, this does not mean that the individual as well as the standard individual is not in good health.
However, on the same individual, a decrease in phase angle will correspond to a decrease in cell reactivity and/or active cell mass.
For the follow-up of high level athletes it is also an interesting tool for monitoring their physical condition and for evaluations in extreme environments or before a competition.
The phase angle as an indicator of fitness and health
Some examples of results of people around 30, average height around 163 cm for women and 173 cm for men :
- Women with low to medium physical activity:
Phase angle should be between 5,5 and 6,5.
- Women with high physical activity or sport:
Phase angle should be between 6,5 and 8.
- Men w
ith low to medium physical activity or sport:
Phase angle should be between 6 and 7,5.
- Men w
ith high physical activity or sport:
Phase angle should be between 7 and 9.
For short people, the phase angle is a little lower and for tall people it is a little higher, which can exceed 10° in some very tall male athletes with highly developed muscles. The taller, more muscular and younger people are, the higher the phase angle.
From the age of 60 to 70 year, the phase angle tends to decrease and very old people naturally have a very low PhA (for example, for a woman of about 100 years old, it can go down to 3 without suffering from a serious disease other than ageing and cell depletion).
Phase angle as Cut off from risk of serious disease
– Women: 4. 6 - Men: 5
Follow-up in the history of the phase angle
The phase angle generally varies little (+/;- 0. 2 °) between 2 measurements:
- If it decreases in a punctual way, it may correspond to a punctual decrease in shape and/or a punctual health problem.
- If it drops significantly and/or regularly it may be due to a more serious cause. In the latter case, it will be important to take regular measurements every week or every two weeks, and if the phase angle continues to decrease regularly (history), it is advisable to carry out additional tests prescribed by a health professional.
The phase angle as "confidence index" of the measurement
If the phase angle is extremely low (2° below the minimum values indicated) or extremely high (2° above the maximum values indicated) in relation to the profile of the person, it may be a case of poor contact at the electrodes. In these cases, we recommend that you carry out a control measurement.
Some examples of correct measurements
Female 45 years old very small (149 cm)
Result above 5° but OK because very small size and female sex
Female 28 years old large (175 cm) but low activity level
Result OK because low activity, female sex and phase angle above 5°
Female 27 years old (163 cm) medium activity level
Result OK
Female 32 years old (163 cm) high activity level
Result OK
Female 26 years old (176 cm) high level sport
Result OK above 8 but large size and especially high activity level
Female 100 years old (147 cm) very low activity
Result OK because very old with low cell mass
Female in her forties (163 cm) with a malignant tumour
Result OK because in the prime of life and of medium size
Some examples of incorrect measurements
52-year-old woman (152 cm) low activity
Incoherent result because of small size, low activity and phase angle much greater than 6. 5°
63-year-old woman (165 cm) medium activity
Incoherent result because significantly greater than 6. 5
The impedance ratio (IR)
Concerning the IR (impedance ratio)
The bioelectrical impedance ratio is the relationship between impedance measurements at high and low frequencies (200/5 kHz). The result is mainly a representation of excellent, normal or abnormal fluid and electrolyte distribution.
For example, citation in the publication « Abnormal Fluid Distribution and Low Handgrip Strength Index as Predictors of Mortality in Mexican Patients with Chronic Heart Failure »*:
« We included 546 hospitalized patients with stable heart failure (53. 3% men ) in a prospective observational study. The presence of an abnormal liquid distribution was determined with a bioelectrical impedance ratio (200/5 kHz) ≥0,85. » « impedance index can be a reliable and effective approach to detect fluid movement from intracellular to extracellular compartments independent of changes in body weight. »
One of the advantages of IR over PhA is that it is not influenced by a person's height, weight or level of muscle mass, allowing stable reference values to be established. There are only a few publications on IR, as it has only recently become apparent that IR can be an extremely interesting marker.
The few studies that we have at our disposal converge towards the interest that can be drawn from this simple data to obtain from Biody Xpert, both in many diseases (heart and kidney failure, lymphedema, gastrointestinal, cancer, inflammation . . . ), as well as in sports.
What we found after statistical analysis of measurements made with Biody Xpert :
- For the women around forty and with an average height, the IR is generally between 0. 750 and 0. 810 , but more generally between 0. 770 and 0. 800
-
For the men around forty and with an average height , the IR is generally between 0. 730 and 0. 800, but more generally between 0. 760 and 0. 790
-Athletes and/or people with a healthy lifestyle and good physical activity are in the lower ranges (0. 730 and 0. 770 , which is probably a way of monitoring their physical condition.
- The higher the IR is above 0. 820, the more people with a risk of pathology with a cut-off from 0. 840 corresponding to people with a pathology, which corresponds to published data.
- As we get older (from 60 to 70 years of age, depending on the case, and earlier in women than in men), IR tends to increase, particularly in women. The reason for this should be explained in further studies.
- Beyond a certain age (85 to 100 years) the IR readings that we currently have are very high and can exceed 0. 900 to 100 years. We do not yet have enough measurements of people of this age to validate this information, but it already seems credible. The reason for this should be explained in further studies.
Publications you can consult :
*Abnormal Fluid Distribution and Low Handgrip Strength Index as Predictors of Mortality in Mexican Patients with Chronic Heart Failure
Lilia Castillo-Mart´ınez PhD , Wendy D Rodr´ıguez-Garc´ıa PhD ,
Dulce G Gonz´ alez-Islas PhD , Arturo Orea-Tejeda MD ,
Mariel Lozada-Mellado MSc , Juan Rodr´ıguez Silverio PhD, Juan Gerardo Reyes-Garc´ıa PhD / PII: S0899-9007(19)30258-8 : DOI:
https://doi.org/10.1016/j.nut.2019.110699 Reference: NUT 110699 Accepted date: 26 November 2019
Impact of oedema on recovery after major abdominal surgery and potential value of multifrequency bioimpedance measurements
E. Itobi1, M. Stroud2 and M Elia2 Department of Surgery and 2Institute of Human Nutrition, Southampton General Hospital, Tremona Road, Southampton, SO16 6YD, UK
Phase angle and impedance ratio: Two specular ways to analyze body composition
Emanuele Rinninella1*; Marco Cintoni1; Giovanni Addolorato2; Silvia Triarico3; Antonio Ruggiero3; Alessia Perna4; Gabriella Silvestri4; Antonio Gasbarrini2; Maria Cristina Mele1
1- Clinical Nutrition, Gastroenterology Area, Catholic University of the Sacred Heart, Italy
2- Department of Internal Medicine and Gastroenterology, Catholic University of the Sacred Heart, Italy
3- Pediatric Oncology Unit, Catholic University of the Sacred Heart, Italy
4- Department of Neurology, Catholic University of the Sacred Heart, Italy
Tissue electrical properties measured by bioelectrical impedance analysis among healthy and sportsmen population
Dominik Kapica1, Joanna Warchulińska2, Monika Jakubiak2, Mariusz Teter2, Radosław Mlak2,
Magdalena Hałabiś3, Waldemar Wójcik1, Teresa Małecka-Massalska2 1Lublin University of Technology, Lublin, Poland; 2Department of Physiology, Medical University of Lublin, Lublin, Poland; 3Department of Laboratory Diagnostics, Medical University of Lublin, Poland
Correlation between PhA and IR
Below are some examples of women oncology staff
Warning : PhA cut-off: 4. 6 minimum value and IR cut-off 0. 840 maximum value
Example 1 of results on women subjects with advanced cancer whose PhA is below its cut-off and whose IR is above its cut-off :
PhA 3,2 – IR 0,857 / PhA 3,7 - IR 0,883 / PhA 4 - IR 0,879 -/ PhA 4,4 – IR 0,850 / -PhA 4,5 – IR 0,870
Example 2 of results on women subjects in oncology departments whose PhA above her cut-off and IR above her cut-off:
PhA 4,6 – IR 0,854 / PhA 4,7 - IR 0,854 / PhA 4,8 - IR 0,849 -/ PhA 4,9 – IR 0,845 / -PhA 5 – IR 0,847
Example 3 of results on women subjects in oncology departments whose PhA is above her cut-off and IR is below her cut-off:
PhA 5,1 – IR 0,830 / PhA 5,2 - IR 0,829 / PhA 5,3 - IR 0,823 -/ PhA 5,4 – IR 0,819 / -PhA 5,5 – IR 0,825
Conclusion: the lower the PhA, the higher the IR, but one can have a high IR even with a PhA above its cut-off.
The two data are therefore well complementary between the state of cell mass, fluid distribution and inflammatory state.
Example of correlation between phase angle and impedance ratio on more than 800 measurements performed with Biody Xpert on a population of women subjects in an oncology department.